

Polish banks tightened standards for housing and consumer loans while continuing to ease access to business finance in the third quarter of 2026. The net balance for changes in consumer lending standards fell to −64.9%, while the strongest increase in demand was recorded for long-term loans to large companies, at 70.1%, according to the NBP survey published on 2 November.
The findings, published by Narodowy Bank Polski (NBP), Poland’s central bank, on 2 November 2026, cover banks’ assessment of the third quarter and expectations for the fourth. Responses were collected in early October from 23 banks accounting for around 90% of the banking sector’s loans to companies and households. The July edition also covered 23 banks, with a market share of around 89%.
Consumer lending showed the strongest restrictions on access to finance. Banks tightened housing lending standards for the first time in seven quarters and consumer lending standards for the first time in ten, while continuing to ease business lending standards. That improvement was uneven: easing for small and medium-sized enterprises (SMEs) was much less widespread than in the spring.
Banks do not expect equally large changes in household lending policy towards year-end. They anticipate keeping policy close to its current level, with rising demand for consumer loans and a further decline in housing loan demand. For companies, they expect further easing and increased demand in all four business lending segments.
How to read the NBP figures
Three concepts need to be distinguished: lending standards, contractual terms and demand. Standards are the minimum requirements a customer must meet for a bank to approve their creditworthiness. Terms include margins, fees, collateral, maximum loan amounts and maturities, while demand describes changes in borrowing interest perceived by banks rather than the value of contracts signed.
The indicators in this article are balances of weighted responses, which NBP calls net percentages. For standards and terms, a positive value indicates a balance in favour of easing and a negative value a balance in favour of tightening. For demand, positive values indicate a balance of responses reporting increases and negative values a balance reporting declines; differences between balances are expressed in percentage points.
A reading of −64.9% therefore does not mean that banks granted 64.9% fewer consumer loans. Nor does it mean that precisely that share of the 23 institutions tightened their standards. Responses are weighted by each bank’s share of the relevant market segment, giving larger institutions more influence; the same bank can have different weights in housing and business lending.
NBP also publishes a diffusion index reflecting the intensity of reported changes. A response indicating a considerable change receives a weight of 100%, and a slight change 50%. This differs from the basic net percentage, so the latest diffusion index is shown alongside each group of figures without combining the two measures when describing quarterly changes.
A zero balance can reflect offsetting responses rather than no change at any bank. Likewise, a decline in a positive balance, for example from 42 to 13, indicates a weaker balance in favour of easing rather than an automatic shift towards tightening. That distinction is particularly relevant to SME lending.
Business standards ease, with a much smaller improvement for SMEs
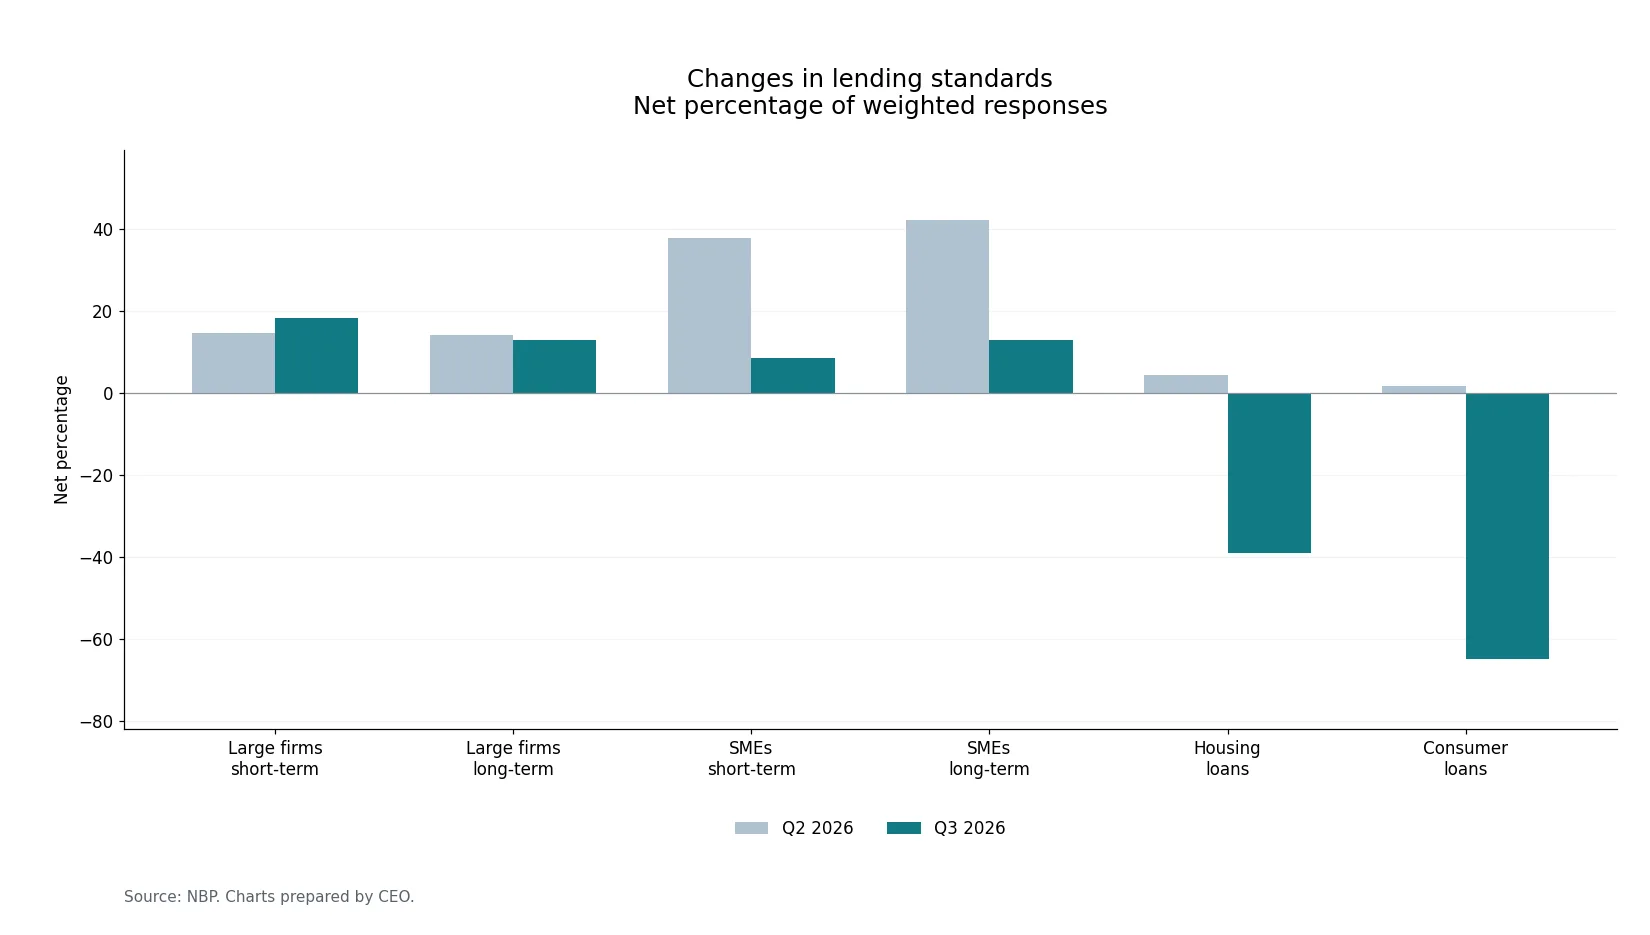
Banks again eased standards in all four business lending categories in Q3. The strongest positive balance was for short-term loans to large companies: 18.32%, up from 14.66% in Q2, an increase of 3.66 percentage points. For long-term loans to large companies, the balance slipped from 14.08% to 12.87%.
The shift was much larger for SMEs. The short-term balance fell from 37.74% to 8.43%, and the long-term balance from 42.23% to 12.88%, declines of around 29.3 percentage points in each case. The direction remained favourable to borrowers, but the weighted balance of banks opening up access to finance was substantially smaller.
The positive SME balances still indicate that banks lowering their requirements prevailed. In the survey, short-term loans have an original maturity of up to one year, including overdrafts, while long-term loans have maturities exceeding one year. This is not a straightforward division between working-capital and investment loans: longer-term borrowing can serve other purposes, so maturity alone does not identify a loan’s use.
| Item | Q2 2026: net percentage | Q3 2026: net percentage | Change in balance, percentage points | Q3 2026: diffusion index |
|---|---|---|---|---|
| Large companies: short-term loans | 14.66 | 18.32 | 3.66 | 9.16 |
| Large companies: long-term loans | 14.08 | 12.87 | −1.21 | 6.43 |
| SMEs: short-term loans | 37.74 | 8.43 | −29.31 | 4.21 |
| SMEs: long-term loans | 42.23 | 12.88 | −29.36 | 6.44 |
Source: NBP, Senior Loan Officer Opinion Survey, Q4 2026 edition. Changes in balances calculated by CEO. Positive values indicate easing or rising demand; negative values indicate tightening or falling demand. For contributing factors, the sign shows the direction of the effect. The diffusion index also reflects the intensity of responses and is not a measure of growth in loan amounts.
Business margins fall, but loan limits stop rising more widely
Business lending prices continued to move in borrowers’ favour. The balance for reductions in standard margins was 19.69%, down from 44.29% in Q2. Banks were still competing on price, although margin cuts were less widespread when weighted by market share.
The balance for reductions in non-interest costs rose from 11.78% to 19.69%. The balance for easing collateral requirements also increased, from 9.78% to 19.56%. Improvements therefore extended beyond interest rates, with some banks making it easier to meet security requirements.
The balance for extending maximum maturities barely changed, at 9.63% against 9.78%. The balance for increasing maximum loan or credit-line amounts fell from 18.65% to zero, while that for reducing margins on higher-risk loans fell from 11.89% to zero. A company could therefore receive better terms without a higher borrowing limit.
The survey does not state how many basis points banks cut their margins by. The response balance cannot be used to calculate the change in the cost of an individual loan.
| Item | Q2 2026: net percentage | Q3 2026: net percentage | Change in balance, percentage points | Q3 2026: diffusion index |
|---|---|---|---|---|
| Lending margin | 44.29 | 19.69 | −24.60 | 9.84 |
| Margin on higher-risk loans | 11.89 | 0.00 | −11.89 | 0.00 |
| Non-interest loan costs | 11.78 | 19.69 | 7.91 | 11.30 |
| Maximum loan or credit-line amount | 18.65 | 0.00 | −18.65 | 0.00 |
| Collateral requirements | 9.78 | 19.56 | 9.78 | 9.78 |
| Maximum loan maturity | 9.78 | 9.63 | −0.15 | 4.82 |
| Other terms | 0.00 | 2.91 | 2.91 | 1.46 |
Source: NBP, Senior Loan Officer Opinion Survey, Q4 2026 edition. Changes in balances calculated by CEO. Positive values indicate easing or rising demand; negative values indicate tightening or falling demand. For contributing factors, the sign shows the direction of the effect. The diffusion index also reflects the intensity of responses and is not a measure of growth in loan amounts.
Competition still supports business borrowers, but its effect weakens
Competitive pressure remained the main factor behind easier business lending policy, with a net balance of 19.69%, down from 44.71% in Q2. The 25.02-percentage-point decline indicates that banks felt substantially less pressure from competitors to improve their offers than three months earlier.
The economic outlook had a positive effect of 9.50%, compared with −3.02% previously. Changes in demand supported easing with a balance of 9.63%, against 11.89%, while other reasons recorded 3.24%. Industry risk was almost neutral at −0.13%.
Banks’ capital positions, NBP monetary policy decisions, the position of their largest borrowers and the share of non-performing loans each recorded zero balances in this part of the survey.
| Item | Q2 2026: net percentage | Q3 2026: net percentage | Change in balance, percentage points | Q3 2026: diffusion index |
|---|---|---|---|---|
| Current or expected capital position of the bank | 9.65 | 0.00 | −9.65 | 0.00 |
| NBP monetary policy decisions | 0.00 | 0.00 | 0.00 | 0.00 |
| Risk associated with the economic outlook | −3.02 | 9.50 | 12.53 | 4.75 |
| Industry risk | −3.02 | −0.13 | 2.89 | −0.06 |
| Risk associated with the position of the largest borrowers | 0.00 | 0.00 | 0.00 | 0.00 |
| Change in the share of non-performing loans in the loan portfolio | 0.00 | 0.00 | 0.00 | 0.00 |
| Changes in competitive pressure | 44.71 | 19.69 | −25.02 | 9.84 |
| Change in demand for business loans | 11.89 | 9.63 | −2.26 | 4.82 |
| Other reasons | 2.91 | 3.24 | 0.33 | 1.62 |
Source: NBP, Senior Loan Officer Opinion Survey, Q4 2026 edition. Changes in balances calculated by CEO. Positive values indicate easing or rising demand; negative values indicate tightening or falling demand. For contributing factors, the sign shows the direction of the effect. The diffusion index also reflects the intensity of responses and is not a measure of growth in loan amounts.
Demand rises across business lending, led by large companies’ long-term borrowing
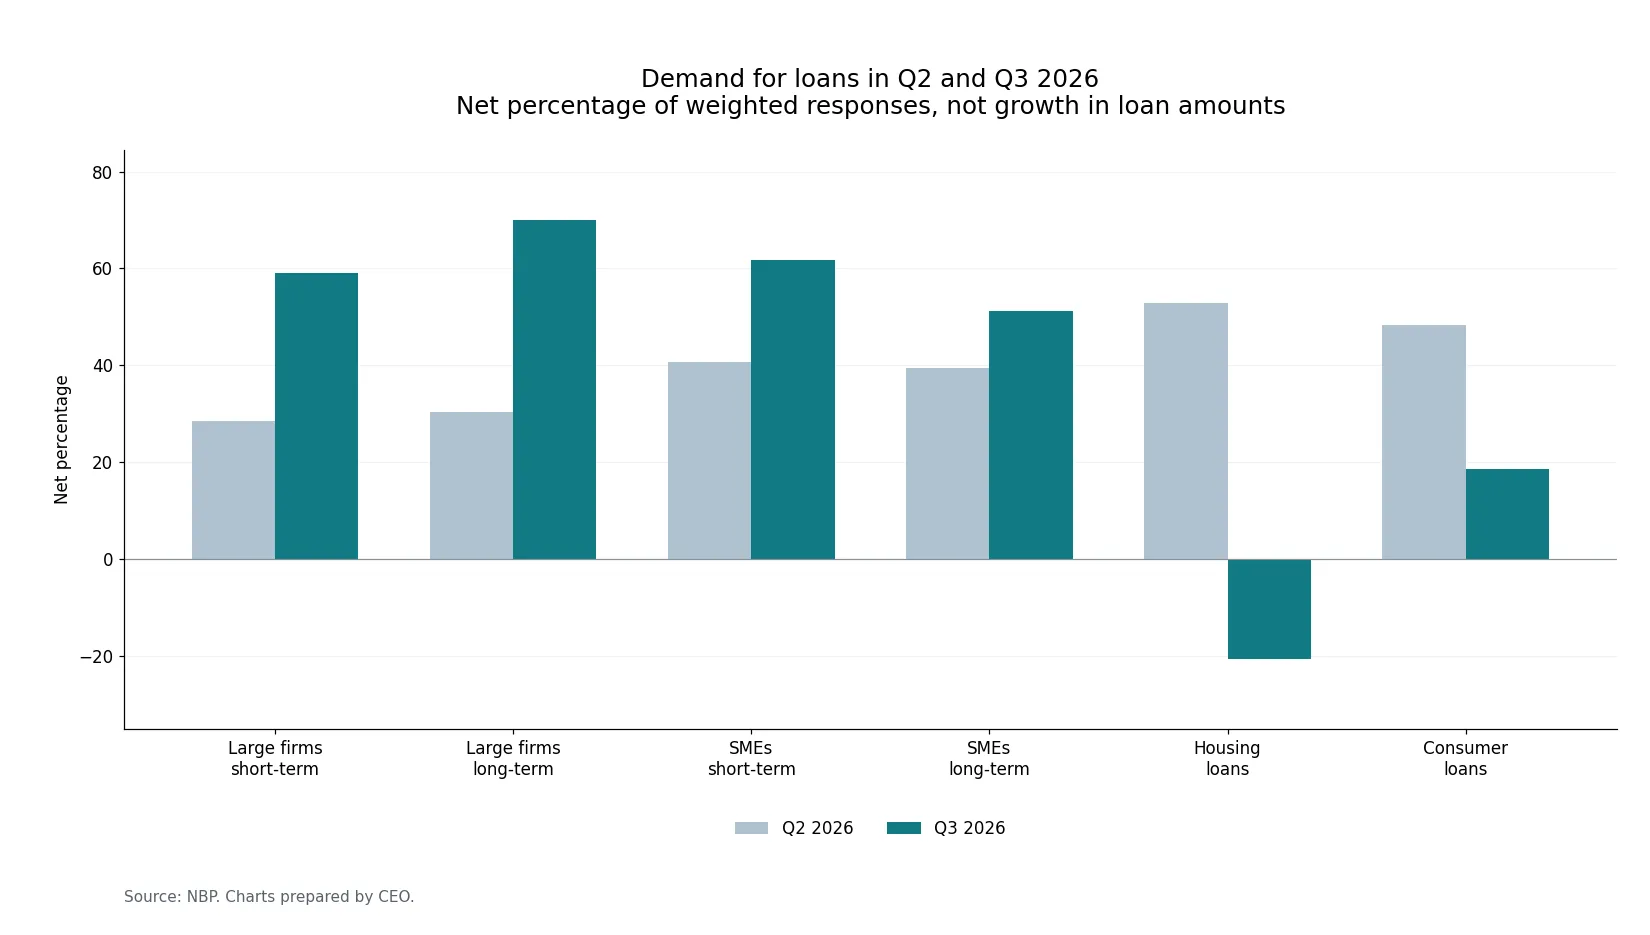
Business demand was considerably stronger than a quarter earlier. The balance for short-term loans to large companies rose from 28.41% to 59.07%, while the long-term balance increased from 30.33% to 70.05%. The latter was the highest demand reading across all six categories surveyed in Q3.
SMEs also showed stronger borrowing interest. The short-term balance rose from 40.76% to 61.66%, and the long-term balance from 39.49% to 51.19%, increases of 20.90 and 11.70 percentage points respectively. The improvement therefore extended beyond the largest corporate clients.
Banks said companies primarily needed finance for inventories, working capital and investment. However, maturity categories do not map precisely onto borrowing purposes: long-term finance can also be used for purposes other than acquiring fixed assets.
| Item | Q2 2026: net percentage | Q3 2026: net percentage | Change in balance, percentage points | Q3 2026: diffusion index |
|---|---|---|---|---|
| Large companies: short-term loans | 28.41 | 59.07 | 30.66 | 29.53 |
| Large companies: long-term loans | 30.33 | 70.05 | 39.72 | 35.03 |
| SMEs: short-term loans | 40.76 | 61.66 | 20.90 | 30.83 |
| SMEs: long-term loans | 39.49 | 51.19 | 11.70 | 25.60 |
Source: NBP, Senior Loan Officer Opinion Survey, Q4 2026 edition. Changes in balances calculated by CEO. Positive values indicate easing or rising demand; negative values indicate tightening or falling demand. For contributing factors, the sign shows the direction of the effect. The diffusion index also reflects the intensity of responses and is not a measure of growth in loan amounts.
Inventories and working capital still outweigh investment needs
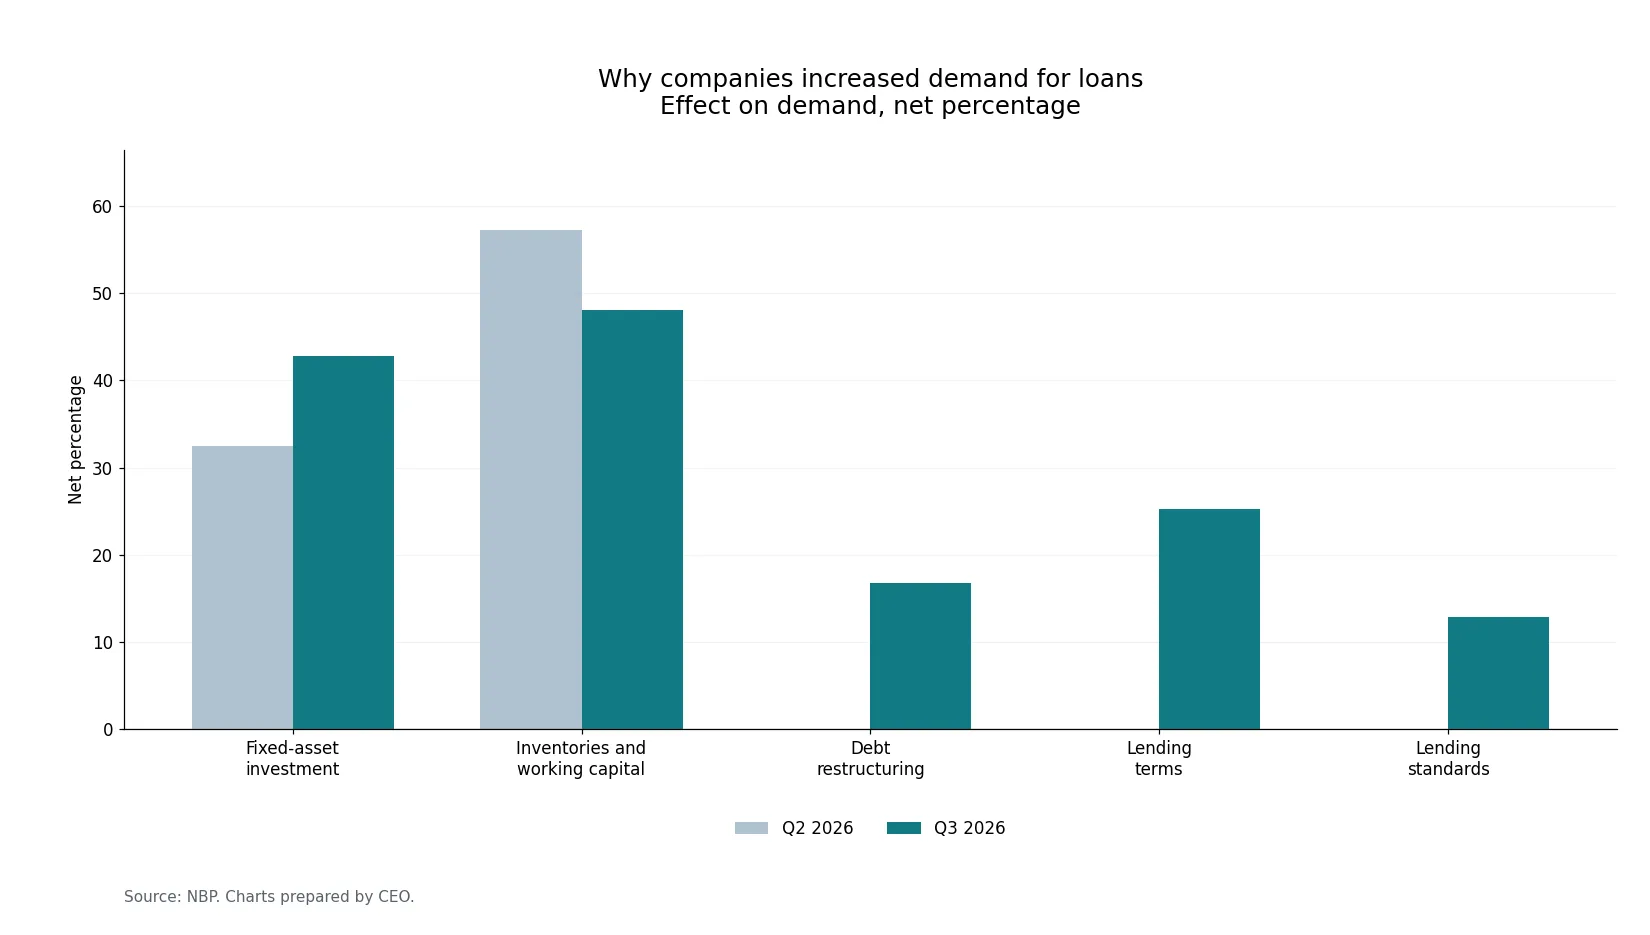
Financing inventories and working capital recorded the highest balance among factors behind increased business demand, at 48.08%. Although down from 57.28% in Q2, it remained above the other factors. The result highlights borrowing used to sustain cash flow, make purchases and bridge the gap between incurring costs and receiving payments.
The balance for fixed-asset investment rose from 32.42% to 42.81%. Its gap with inventories and working capital narrowed from 24.86 to 5.27 percentage points. This compares survey balances rather than loan values, but indicates that investment needs were more prominent in responses than in the spring.
NBP reports the reasons for demand changes for companies collectively. The survey does not allow investment needs to be assigned to a specific industry or solely to large companies. Demand associated with debt restructuring also increased, with a balance of 16.78%, up from zero, reflecting finance used to change existing obligations.
The balance for mergers and acquisitions remained zero. Alternative sources of finance also recorded zero, against −11.89% in Q2.
| Item | Q2 2026: net percentage | Q3 2026: net percentage | Change in balance, percentage points | Q3 2026: diffusion index |
|---|---|---|---|---|
| Changes in financing needs for fixed assets (investment) | 32.42 | 42.81 | 10.39 | 19.95 |
| Changes in financing needs for inventories and working capital | 57.28 | 48.08 | −9.20 | 24.72 |
| Changes in financing needs for mergers and acquisitions | 0.00 | 0.00 | 0.00 | 0.00 |
| Changes in financing needs for debt restructuring | 0.00 | 16.78 | 16.78 | 8.39 |
| Use of alternative sources of finance | −11.89 | 0.00 | 11.89 | 0.00 |
| Change in business lending terms | 0.00 | 25.26 | 25.26 | 14.08 |
| Change in business lending standards | 0.00 | 12.84 | 12.84 | 6.42 |
| Other factors | 16.81 | 0.00 | −16.81 | 0.00 |
Source: NBP, Senior Loan Officer Opinion Survey, Q4 2026 edition. Changes in balances calculated by CEO. Positive values indicate easing or rising demand; negative values indicate tightening or falling demand. For contributing factors, the sign shows the direction of the effect. The diffusion index also reflects the intensity of responses and is not a measure of growth in loan amounts.
Better lending offers provide more support for business demand
Banks separately reported that changes in lending terms supported demand, with the balance rising from zero to 25.26%. The balance for lending standards rose from zero to 12.84%. These responses suggest that banks were seeing easier offers reflected in customer interest, as well as in their own lending decisions.
SME demand rises despite banks’ forecasts of a decline
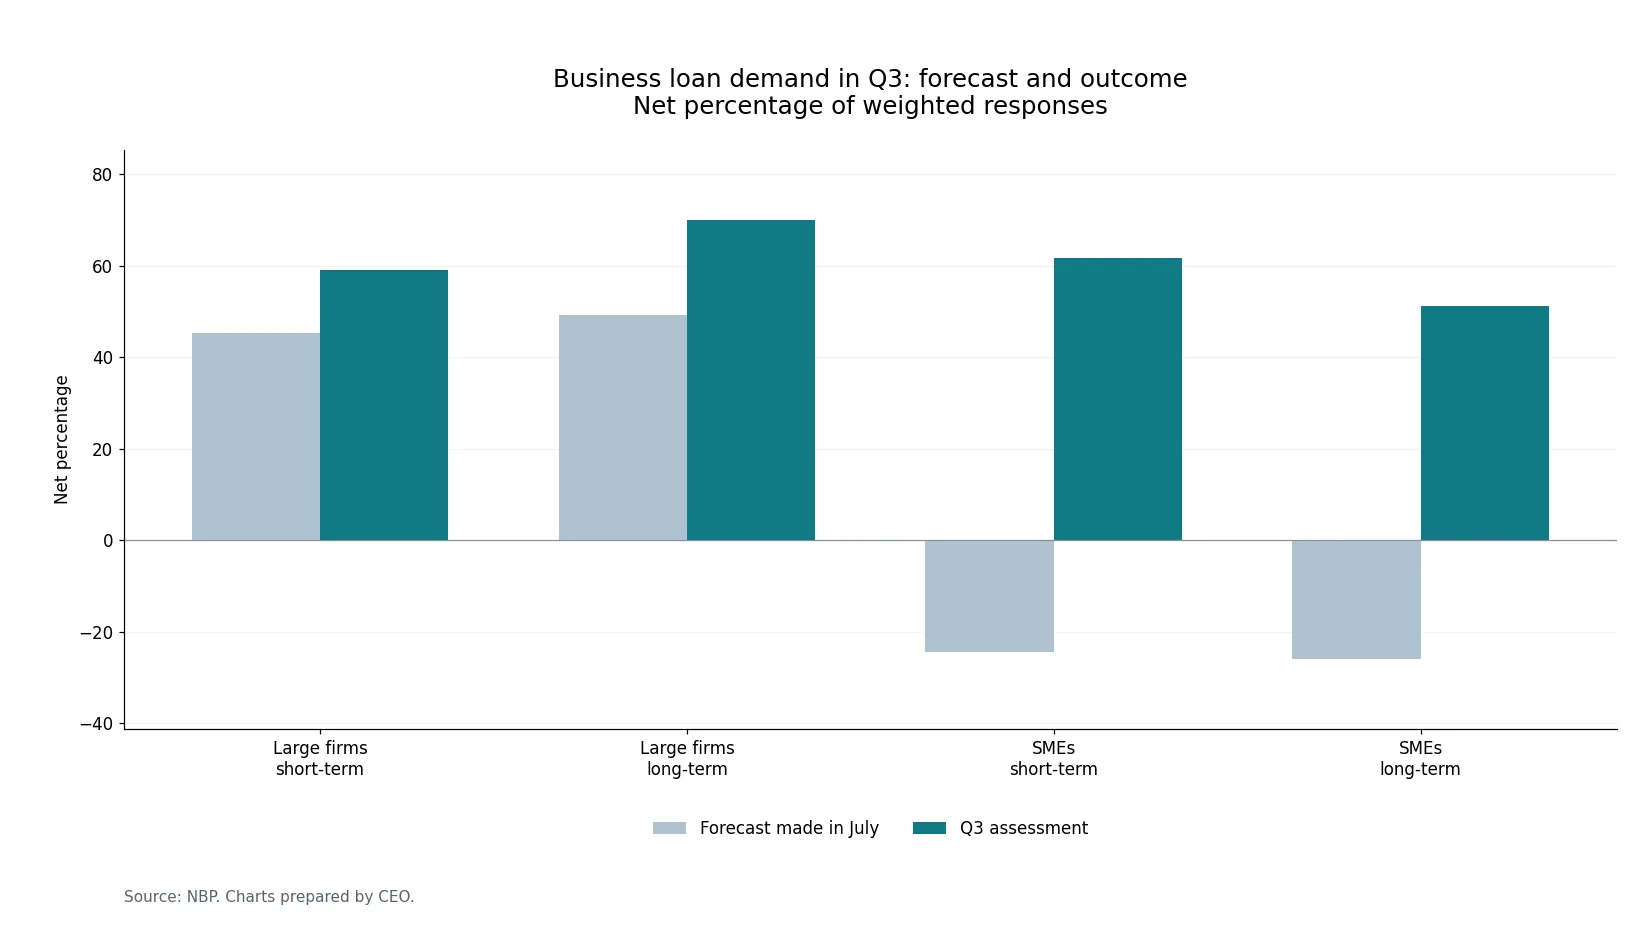
The comparison with the previous survey reveals a particularly large gap for SMEs. In early July, banks expected demand in Q3 to decline, with forecast balances of −24.50% for short-term loans and −25.97% for long-term loans. Their subsequent assessments were 61.66% and 51.19% respectively.
The differences between forecasts and assessments reached 86.16 percentage points for short-term lending and 77.16 points for long-term lending. These are divergences in the direction and balance of qualitative responses, rather than percentage forecasting errors for loan sales. Banks had expected declines to prevail but instead reported a clear balance of increases.
For large companies, banks predicted the direction correctly, but the subsequent assessments were stronger. The short-term forecast of 45.33% compares with a reading of 59.07%, and the long-term forecast of 49.25% with 70.05%. The gaps were 13.74 and 20.80 percentage points.
Housing lending standards tighten for the first time in seven quarters
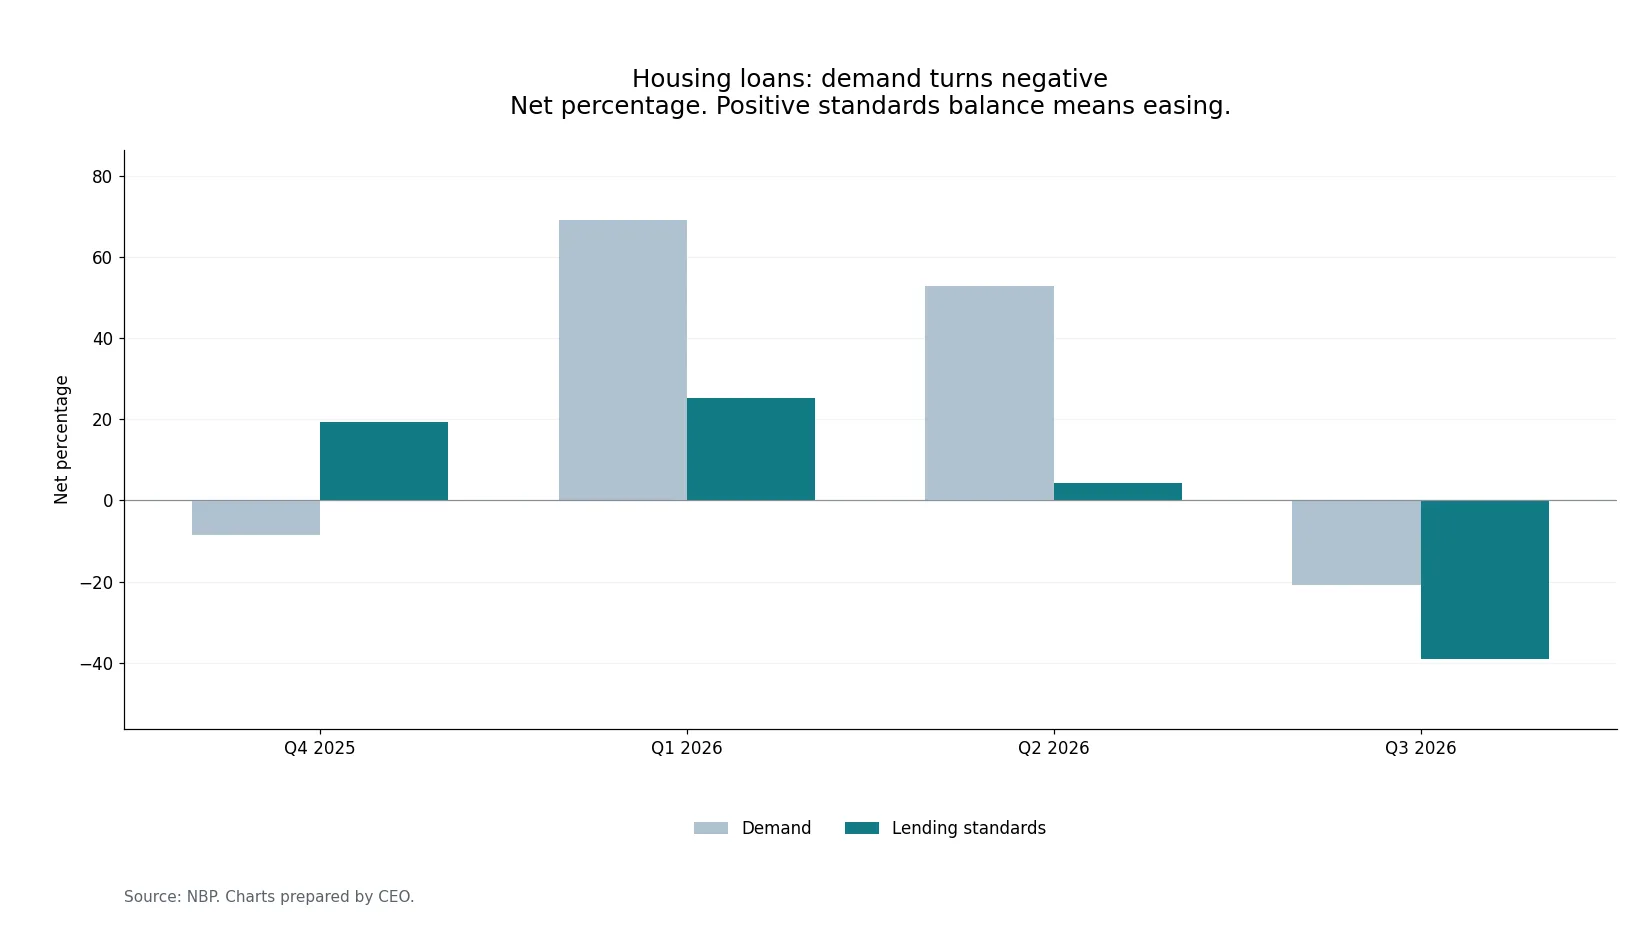
The housing loan standards balance fell from 4.43% in Q2 to −39.10% in Q3, a change of 43.53 percentage points. NBP describes this as the first tightening in seven quarters. A reading close to stability gave way to a clear weighted balance of banks restricting access.
This did not produce a uniform increase in costs for borrowers who still qualified. The balance for reductions in standard margins remained positive at 19.25%, against 20.85% previously, while that for higher-risk margins reached 8.55%, against 8.10%. Banks could simultaneously tighten borrower assessments and improve the price of the product available to qualifying customers.
Stricter rules for recognising income can reduce some households’ borrowing capacity even as margins fall. Pricing and customer eligibility are separate aspects of lending policy. Most other mortgage terms did not indicate widespread tightening: collateral and maximum maturity balances were both 8.55%, non-interest costs recorded 3.95%, and down-payment requirements zero.
Recognition of 800+ benefits contributes to tighter credit assessments
The largest negative balance among factors affecting housing lending policy was in the category covering reasons not listed separately in the questionnaire, at −52.53%. NBP explains that banks cited changes in the recognition of income from benefits, including the 800+ child benefit. This can affect creditworthiness without an increase in loan margins.
The report does not name the banks or set out their detailed rules for treating 800+ payments as income. It describes the reasons reported by respondents. Competition supported easing with a balance of 19.25%, down from 27.85% in Q2, while changes in demand recorded 15.30%.
Banks’ capital positions and the housing market outlook each recorded a positive balance of 8.55%. Economic outlook risk had a small negative balance of −3.68%, compared with −12.30% previously. NBP decisions and changes in the share of non-performing loans remained at zero.
“Other terms” recorded −33.86% for housing loans. NBP cautions that some banks mistakenly included tighter lending standards in this category. The figure should therefore neither be treated as evidence of a separate additional set of restrictions nor added to the −39.10% standards balance.
| Item | Q2 2026: net percentage | Q3 2026: net percentage | Change in balance, percentage points | Q3 2026: diffusion index |
|---|---|---|---|---|
| Lending margin | 20.85 | 19.25 | −1.60 | 9.62 |
| Margin on higher-risk loans | 8.10 | 8.55 | 0.45 | 4.27 |
| Non-interest loan costs | 0.00 | 3.95 | 3.95 | 1.97 |
| Collateral requirements | 8.42 | 8.55 | 0.13 | 8.55 |
| Required borrower contribution to the investment | 8.10 | 0.00 | −8.10 | 0.00 |
| Maximum loan maturity | 0.00 | 8.55 | 8.55 | 8.55 |
| Other terms | −3.99 | −33.86 | −29.87 | −16.93 |
Source: NBP, Senior Loan Officer Opinion Survey, Q4 2026 edition. Changes in balances calculated by CEO. Positive values indicate easing or rising demand; negative values indicate tightening or falling demand. For contributing factors, the sign shows the direction of the effect. The diffusion index also reflects the intensity of responses and is not a measure of growth in loan amounts.
| Item | Q2 2026: net percentage | Q3 2026: net percentage | Change in balance, percentage points | Q3 2026: diffusion index |
|---|---|---|---|---|
| Current and expected capital position of the bank | 8.10 | 8.55 | 0.45 | 4.27 |
| NBP monetary policy decisions | 0.00 | 0.00 | 0.00 | 0.00 |
| Risk associated with the economic outlook | −12.30 | −3.68 | 8.61 | −1.84 |
| Housing market outlook | 0.32 | 8.55 | 8.23 | 4.27 |
| Change in the share of non-performing housing loans | 0.00 | 0.00 | 0.00 | 0.00 |
| Change in competitive pressure | 27.85 | 19.25 | −8.60 | 9.78 |
| Change in demand for housing loans | 13.40 | 15.30 | 1.90 | 7.65 |
| Other reasons | −3.99 | −52.53 | −48.55 | −26.27 |
Source: NBP, Senior Loan Officer Opinion Survey, Q4 2026 edition. Changes in balances calculated by CEO. Positive values indicate easing or rising demand; negative values indicate tightening or falling demand. For contributing factors, the sign shows the direction of the effect. The diffusion index also reflects the intensity of responses and is not a measure of growth in loan amounts.
Housing loan demand falls after two quarters of growth
The demand balance for housing loans was −20.73%, compared with 52.80% in Q2. The 73.53-percentage-point deterioration was the largest quarterly change among the demand categories surveyed. NBP reports the first decline in three quarters; the balance had been 69.21% in Q1 2026 and −8.60% in Q4 2025.
Greater use of alternative finance was the strongest factor behind falling demand, with a balance of −31.34%. NBP’s commentary identified loans from other banks as the leading alternative, at around −31%. Household savings and other sources each recorded around −12%.
A customer moving to a competing bank is different from abandoning a property purchase. Choosing another lender reduces demand at the first bank while the underlying financing need can persist. This factor should therefore not automatically be read as evidence that buyers across the sector were giving up their purchases.
| Item | Q2 2026: net percentage | Q3 2026: net percentage | Change in balance, percentage points | Q3 2026: diffusion index |
|---|---|---|---|---|
| Housing loans | 52.80 | −20.73 | −73.53 | −5.94 |
| Consumer and other loans | 48.30 | 18.50 | −29.81 | 12.32 |
Source: NBP, Senior Loan Officer Opinion Survey, Q4 2026 edition. Changes in balances calculated by CEO. Positive values indicate easing or rising demand; negative values indicate tightening or falling demand. For contributing factors, the sign shows the direction of the effect. The diffusion index also reflects the intensity of responses and is not a measure of growth in loan amounts.
The housing outlook provides less support for mortgage demand
Not every factor affecting housing loan demand was negative. The housing outlook continued to support borrowing interest, but its balance fell from 38.66% to 10.20%. Better lending terms recorded 12.80%, compared with 19.43% a quarter earlier.
The positive influence of changes in standards weakened more sharply, from 14.83% to 2.44%. This does not contradict the aggregate tightening: banks citing easier standards as a source of demand can differ from those reporting tighter policy. The aggregate combines institutions with different offers, customers and quarterly experiences.
Households’ economic situation recorded a small positive balance of 4.26%, against 3.99% in Q2. It does not suggest a widespread assessment that deteriorating family finances drove weaker mortgage interest. Changes in consumer spending were neutral, and other factors recorded 3.91%.
| Item | Q2 2026: net percentage | Q3 2026: net percentage | Change in balance, percentage points | Q3 2026: diffusion index |
|---|---|---|---|---|
| Housing market outlook | 38.66 | 10.20 | −28.46 | 5.10 |
| Changes in consumer spending | 0.00 | 0.00 | 0.00 | 0.00 |
| Use of alternative sources of finance | 18.82 | −31.34 | −50.15 | −15.67 |
| Change in households’ economic situation | 3.99 | 4.26 | 0.27 | 2.28 |
| Change in housing lending terms | 19.43 | 12.80 | −6.63 | 6.56 |
| Change in housing lending standards | 14.83 | 2.44 | −12.39 | 1.22 |
| Other factors | 2.81 | 3.91 | 1.11 | 1.96 |
Source: NBP, Senior Loan Officer Opinion Survey, Q4 2026 edition. Changes in balances calculated by CEO. Positive values indicate easing or rising demand; negative values indicate tightening or falling demand. For contributing factors, the sign shows the direction of the effect. The diffusion index also reflects the intensity of responses and is not a measure of growth in loan amounts.
Consumer lending sees the strongest tightening in the survey
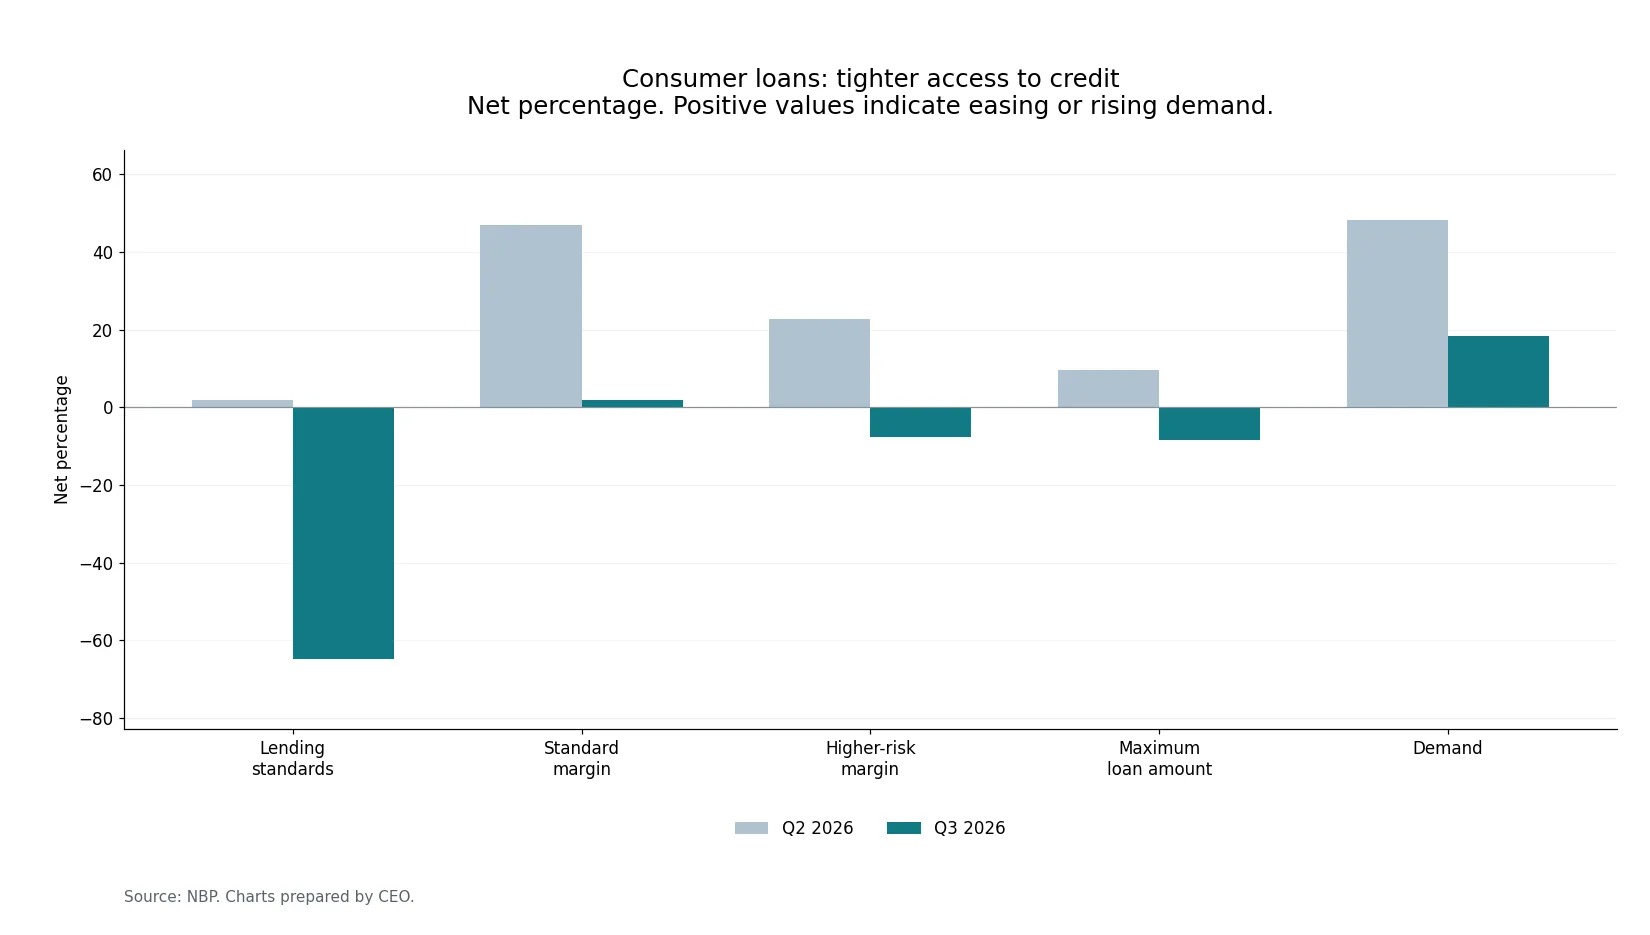
The consumer lending standards balance fell from 1.84% to −64.86%, a change of 66.70 percentage points, substantially larger than for housing loans. Stability in the previous quarter gave way to a clear restriction in access. NBP identifies this as the first tightening in ten quarters.
Some contractual terms also tightened. The maximum loan amount balance fell from 9.74% to −8.34%, while the higher-risk margin balance moved from 22.77% to −7.56%. Borrowers could therefore face a lower available amount or a higher price for finance where risk was elevated.
The standard margin balance remained close to stability, at 1.79% compared with 47.02% in Q2. The strong balance of banks cutting margins in the spring almost disappeared over the summer. This does not establish that banks generally raised standard margins for all customers.
Non-interest costs and collateral requirements recorded zero balances. Maximum maturities were extended, with a balance of 9.73%, while other terms recorded −22.78%. Tightening therefore varied across parameters, with the strongest change in customer eligibility and smaller movements in selected contractual terms.
| Item | Q2 2026: net percentage | Q3 2026: net percentage | Change in balance, percentage points | Q3 2026: diffusion index |
|---|---|---|---|---|
| Housing loans | 4.43 | −39.10 | −43.53 | −15.28 |
| Consumer loans | 1.84 | −64.86 | −66.70 | −32.43 |
Source: NBP, Senior Loan Officer Opinion Survey, Q4 2026 edition. Changes in balances calculated by CEO. Positive values indicate easing or rising demand; negative values indicate tightening or falling demand. For contributing factors, the sign shows the direction of the effect. The diffusion index also reflects the intensity of responses and is not a measure of growth in loan amounts.
| Item | Q2 2026: net percentage | Q3 2026: net percentage | Change in balance, percentage points | Q3 2026: diffusion index |
|---|---|---|---|---|
| Lending margin | 47.02 | 1.79 | −45.23 | 0.89 |
| Margin on higher-risk loans | 22.77 | −7.56 | −30.33 | −3.78 |
| Non-interest loan costs | 10.32 | 0.00 | −10.32 | 0.00 |
| Collateral requirements | 0.00 | 0.00 | 0.00 | 0.00 |
| Maximum loan amount | 9.74 | −8.34 | −18.08 | −4.17 |
| Maximum loan maturity | 0.00 | 9.73 | 9.73 | 4.86 |
| Other terms | 13.88 | −22.78 | −36.67 | −11.39 |
Source: NBP, Senior Loan Officer Opinion Survey, Q4 2026 edition. Changes in balances calculated by CEO. Positive values indicate easing or rising demand; negative values indicate tightening or falling demand. For contributing factors, the sign shows the direction of the effect. The diffusion index also reflects the intensity of responses and is not a measure of growth in loan amounts.
Supervisory recommendations and business decisions outweigh competition
The main explanation for tighter consumer lending policy appeared under “other factors”, whose balance reached −70.92%, against −0.91% a quarter earlier. Banks cited supervisory recommendations and business decisions among their reasons. NBP does not publish separate balances for these explanations, so their individual contributions cannot be determined.
Economic outlook risk supported tightening with a balance of −9.96%. Changes in the share of non-performing loans recorded −8.44%, signalling greater caution among some respondents. That indicator measures the factor’s effect on policy rather than the change in the non-performing loan ratio itself.
Competition still supported easing, with a positive balance of 14.00%. Its influence nevertheless weakened by 41.64 percentage points from 55.64% in Q2.
| Item | Q2 2026: net percentage | Q3 2026: net percentage | Change in balance, percentage points | Q3 2026: diffusion index |
|---|---|---|---|---|
| Current and expected capital position of the bank | 8.43 | 0.00 | −8.43 | 0.00 |
| NBP monetary policy decisions | 11.74 | 0.00 | −11.74 | 0.00 |
| Risk associated with the economic outlook | 0.00 | −9.96 | −9.96 | −4.98 |
| Risk associated with realising the required collateral | 0.00 | 0.00 | 0.00 | 0.00 |
| Change in the share of non-performing consumer loans | 9.43 | −8.44 | −17.88 | −4.22 |
| Competitive pressure | 55.64 | 14.00 | −41.64 | 7.00 |
| Change in demand for consumer loans | 21.89 | 0.00 | −21.89 | 0.00 |
| Other factors | −0.91 | −70.92 | −70.01 | −37.65 |
Source: NBP, Senior Loan Officer Opinion Survey, Q4 2026 edition. Changes in balances calculated by CEO. Positive values indicate easing or rising demand; negative values indicate tightening or falling demand. For contributing factors, the sign shows the direction of the effect. The diffusion index also reflects the intensity of responses and is not a measure of growth in loan amounts.
Consumer demand continues to rise, but less strongly
Despite tighter standards, banks reported increasing demand for consumer loans. The balance was 18.50%, compared with 48.30% in Q2. The 29.80-percentage-point decline indicates a smaller balance of responses reporting rising interest. Demand remained positive, but the picture was much weaker than three months earlier.
Durable goods purchases provided the strongest positive contribution, with a balance of 22.17%, up from 13.79%. This purpose became more prominent even as the overall demand indicator weakened. Reduced support from other factors can outweigh the greater importance of one borrowing need.
The balance for the effect of lending terms fell from 30.67% to 1.30%, while that for standards declined from 14.35% to 3.67%. Improvements in offers therefore provided much less support than in the spring. The balance for households’ economic situation also fell, from 11.74% to 1.32%.
Alternative sources of finance recorded 9.73%, almost unchanged. Banks said reduced use of other sources, particularly loans from competing institutions, supported demand for their own offers. This was the opposite of housing lending, where alternative sources were the main factor reducing demand.
Securities purchases recorded a small positive balance of 1.32%. Other factors were neutral.
| Item | Q2 2026: net percentage | Q3 2026: net percentage | Change in balance, percentage points | Q3 2026: diffusion index |
|---|---|---|---|---|
| Changes in financing needs for durable goods purchases | 13.79 | 22.17 | 8.38 | 15.95 |
| Changes in financing needs for securities purchases | 0.00 | 1.32 | 1.32 | 0.66 |
| Use of alternative sources of finance | 9.74 | 9.73 | −0.01 | 4.86 |
| Change in households’ economic situation | 11.74 | 1.32 | −10.43 | 0.66 |
| Change in consumer lending terms | 30.67 | 1.30 | −29.37 | 0.65 |
| Change in consumer lending standards | 14.35 | 3.67 | −10.67 | 1.84 |
| Other factors | 0.00 | 0.00 | 0.00 | 0.00 |
Source: NBP, Senior Loan Officer Opinion Survey, Q4 2026 edition. Changes in balances calculated by CEO. Positive values indicate easing or rising demand; negative values indicate tightening or falling demand. For contributing factors, the sign shows the direction of the effect. The diffusion index also reflects the intensity of responses and is not a measure of growth in loan amounts.
Banks expect further easing and stronger business demand in Q4
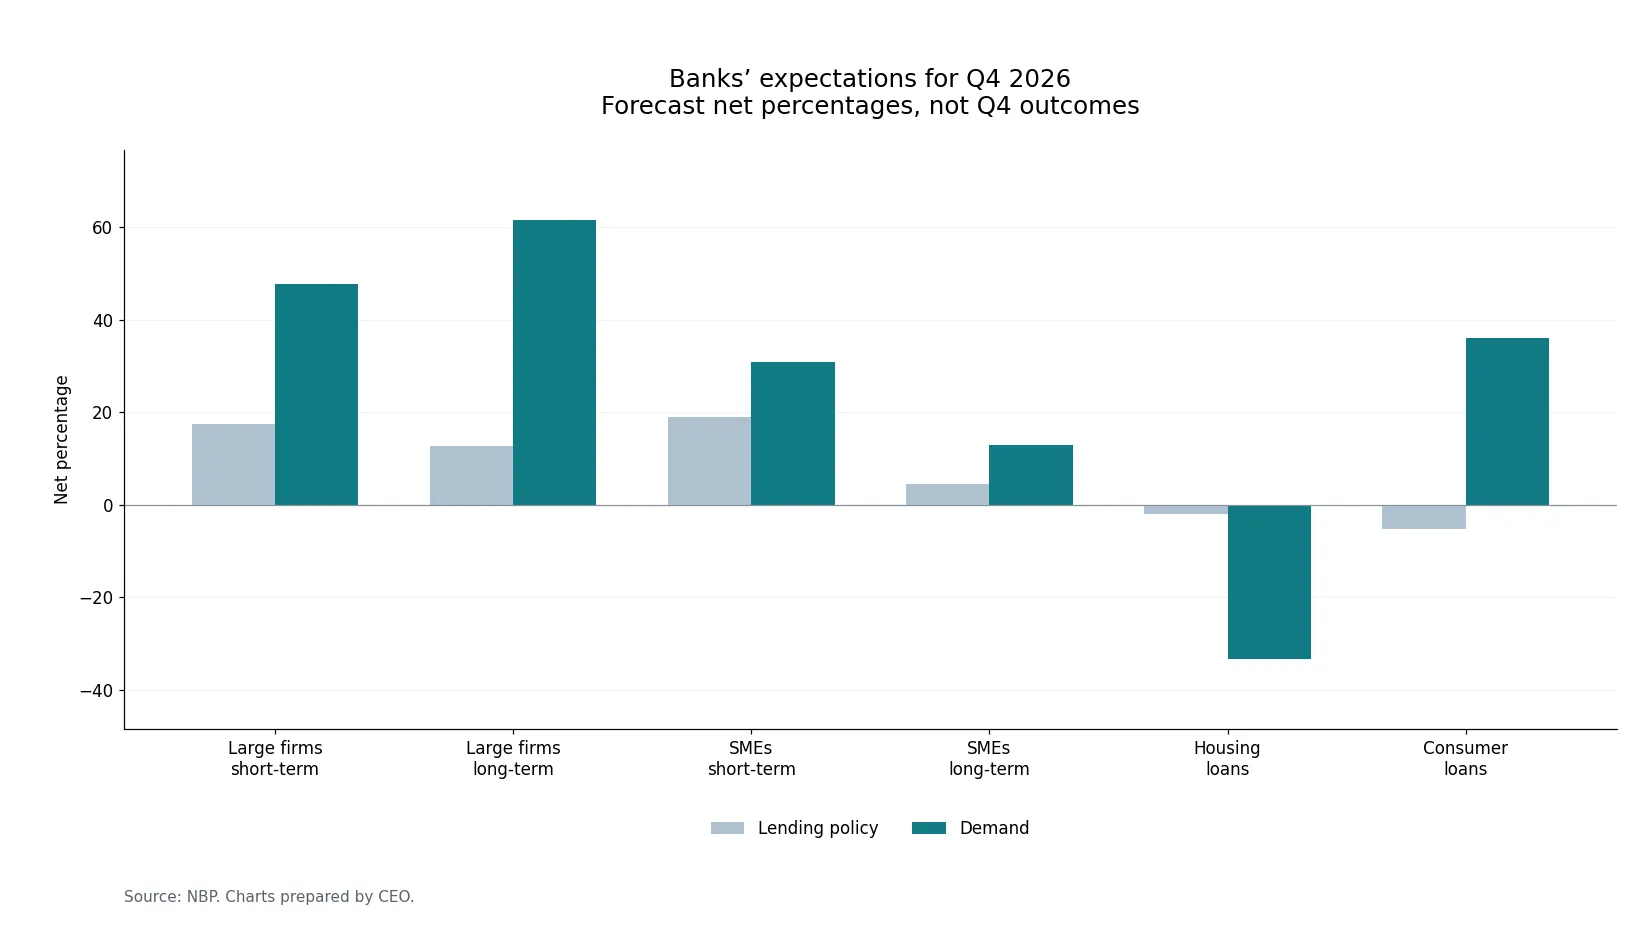
Forecasts for Q4 point to further easing of business lending policy. The balances for large companies are 17.41% for short-term and 12.79% for long-term finance. For SMEs, they are 19.08% and 4.43%, with the weakest balance of easing expected in long-term SME lending.
Demand forecasts are positive across all four business segments. Large companies’ long-term loans lead at 61.56%, followed by their short-term loans at 47.78%. The SME forecasts are 30.92% for short-term and 12.93% for long-term borrowing.
Every business demand forecast is below its Q3 assessment. That does not imply an expected decline in loan values: all balances remain positive, indicating continued growth in borrowing interest with a smaller balance of responses reporting increases. Long-term SME lending is particularly cautious, at 12.93% against 51.19% recorded for Q3.
Lending policy forecasts refer to standards or terms. They reflect banks’ expectations in early October, rather than outcomes for the full fourth quarter.
| Item | Q4 2026: forecast, net percentage | Q4 2026: diffusion index |
|---|---|---|
| Large companies: short-term loans | 17.41 | 8.71 |
| Large companies: long-term loans | 12.79 | 6.40 |
| SMEs: short-term loans | 19.08 | 9.54 |
| SMEs: long-term loans | 4.43 | 2.21 |
Source: NBP, Senior Loan Officer Opinion Survey, Q4 2026 edition. Changes in balances calculated by CEO. Positive values indicate easing or rising demand; negative values indicate tightening or falling demand. For contributing factors, the sign shows the direction of the effect. The diffusion index also reflects the intensity of responses and is not a measure of growth in loan amounts.
| Item | Q4 2026: forecast, net percentage | Q4 2026: diffusion index |
|---|---|---|
| Large companies: short-term loans | 47.78 | 23.89 |
| Large companies: long-term loans | 61.56 | 30.78 |
| SMEs: short-term loans | 30.92 | 15.46 |
| SMEs: long-term loans | 12.93 | 6.46 |
Source: NBP, Senior Loan Officer Opinion Survey, Q4 2026 edition. Changes in balances calculated by CEO. Positive values indicate easing or rising demand; negative values indicate tightening or falling demand. For contributing factors, the sign shows the direction of the effect. The diffusion index also reflects the intensity of responses and is not a measure of growth in loan amounts.
Housing loans are the only category with a negative year-end demand forecast
Banks expect household lending policy to stabilise in Q4. The forecast balances are −2.01% for housing loans and −5.21% for consumer loans, slightly negative but far smaller than the tightening recorded in Q3. NBP describes these expectations as maintaining policy.
Maintaining policy means keeping the tightened rules in place, rather than returning to earlier requirements. Consumer loan demand is expected to rise further, with a balance of 35.96%, above the Q3 assessment of 18.50%. This indicates a larger expected balance of responses reporting growth, without specifying how many additional customers will be approved.
Housing lending has the opposite forecast, at −33.31%. Banks expect demand to keep falling, with a greater balance of negative responses than in Q3. It is the only one of the six demand categories with a negative forecast for the end of the year.
| Item | Q4 2026: forecast, net percentage | Q4 2026: diffusion index |
|---|---|---|
| Housing loans | −2.01 | −1.01 |
| Consumer loans | −5.21 | −2.61 |
Source: NBP, Senior Loan Officer Opinion Survey, Q4 2026 edition. Changes in balances calculated by CEO. Positive values indicate easing or rising demand; negative values indicate tightening or falling demand. For contributing factors, the sign shows the direction of the effect. The diffusion index also reflects the intensity of responses and is not a measure of growth in loan amounts.
| Item | Q4 2026: forecast, net percentage | Q4 2026: diffusion index |
|---|---|---|
| Housing loans | −33.31 | −16.65 |
| Consumer loans | 35.96 | 17.98 |
Source: NBP, Senior Loan Officer Opinion Survey, Q4 2026 edition. Changes in balances calculated by CEO. Positive values indicate easing or rising demand; negative values indicate tightening or falling demand. For contributing factors, the sign shows the direction of the effect. The diffusion index also reflects the intensity of responses and is not a measure of growth in loan amounts.
The sources of demand growth have shifted since the start of the year
Comparing the first three quarters helps distinguish quarterly fluctuations from more persistent changes. Housing loans had the highest demand balance at the start of 2026, at 69.21%, but were the only negative category by Q3. The strongest reading moved to large companies’ long-term borrowing, where the balance rose from 31.61% in Q1 to 70.05% in Q3.
Large companies’ short-term readings were 43.52%, 28.41% and 59.07% across the three quarters. The balance first weakened and then strengthened sharply. Short-term SME borrowing followed a similar path, at 52.41%, 40.76% and 61.66%.
Long-term SME demand recorded 50.85%, 39.49% and 51.19%, putting Q3 close to the start-of-year level and well above the spring reading. Consumer loan demand was 43.69%, 48.30% and 18.50%. Its Q3 balance of increases was the weakest of 2026, but demand did not reverse direction as it did for housing loans.
For SME lending standards, the short-term easing balance fell from 39.67% in Q1 to 37.74% in Q2 and 8.43% in Q3. Long-term balances were 20.20%, 42.23% and 12.88%. Access therefore improved less widely than in the spring despite stronger demand.
What the survey measures
The tables compare Q2 and Q3 2026 and show Q4 expectations. Response balances describe the direction of changes rather than growth in loan amounts. Contributing factors do not add up to 100 because banks could identify several reasons; for competition and alternative finance, NBP reports the factor with the strongest effect.
The survey records assessments by chairs of banks’ credit committees, weighted by market share in each segment. NBP calculates those weights using average outstanding loans in the first two months of the preceding quarter. Third-month data are not yet available when the survey is prepared.
Data sources: Narodowy Bank Polski, Senior Loan Officer Opinion Survey, Q3 and Q4 2026 editions, questionnaire, and net-percentage and diffusion-index spreadsheets. All assessments of changes reflect banks’ responses; forecasts refer to Q4 2026. Polish original published on 2 November 2026: CEO.