
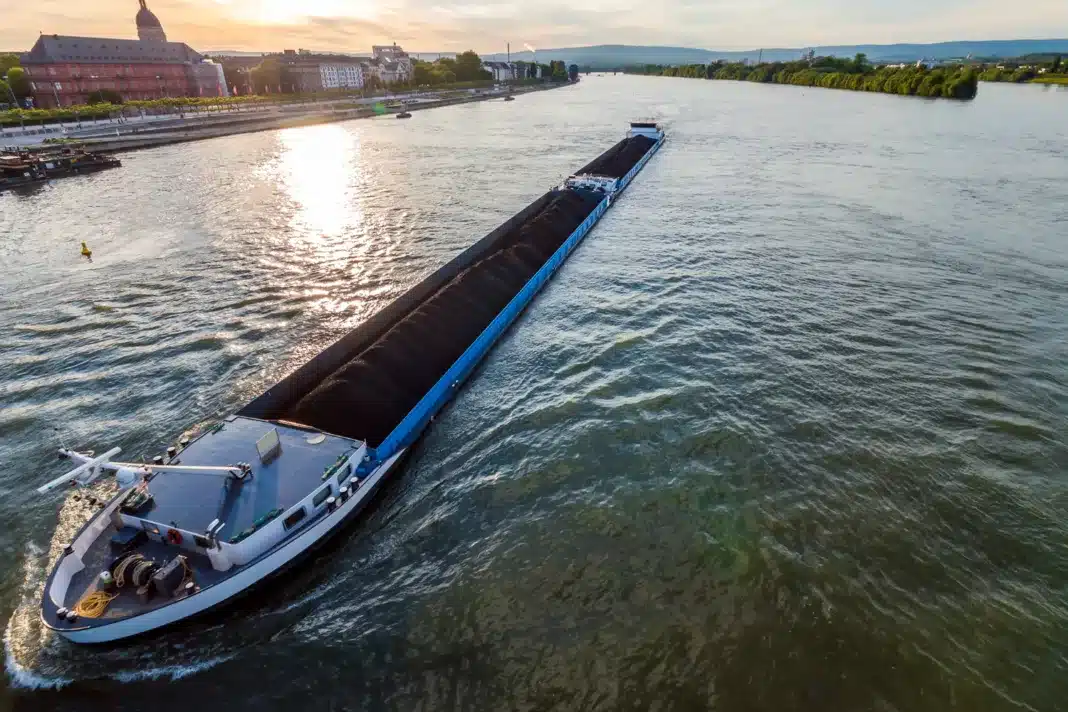


Poland’s inland waterway network moved 1,672.0 thousand tonnes of cargo in 2025, a volume essentially unchanged from the year before and equal to just 0.07% of the country’s total freight transport. New data released by Statistics Poland (GUS) on 29 July 2026 points to a sector held back less by a lack of demand than by decades of underinvestment in the rivers, canals and vessels that make up the network.
Key figures for 2025
- Total cargo carried: 1,672.0 thousand tonnes (-0.1% year-on-year)
- Transport work: 364.5 million tonne-kilometres (-5.3% y/y)
- Domestic cargo volume: 598.8 thousand tonnes (+26.1% y/y)
- Share of inland waterways in Poland’s total freight transport: 0.07%
- Waterway network: 3,767.4 km, of which only 5.5% meets international Class IV/V standards
- Fleet: 136 tugs and pushers, 230 barges, 121 passenger vessels
- Passengers carried: 1,007,575 (-8.1% y/y)
- Shipping accidents recorded: 3, none involving dangerous cargo
A network that has barely changed in decades
Poland’s network of navigable inland waterways covered 3,767.4 km in 2025: 2,522.2 km of regulated navigable rivers, 655.7 km of canalized river sections, 334.7 km of canals and 254.8 km of navigable lakes. Of this total, only 3,519.2 km – 93.4% – was actually in navigational use; the rest sits idle for lack of maintenance or because it no longer meets basic navigability standards. Just 205.9 km, or 5.5% of the network, is classified to the international standard (Class IV or V) that allows large, modern vessels to operate. The remaining 3,561.5 km is limited to smaller, regional-class traffic (Class I, II or III).
Structure of Poland’s operated inland waterway network, 2025 (%)
Source: Statistics Poland (GUS).
A fleet that is shrinking where it should be growing
Poland’s inland waterway fleet totalled 230 barges, 136 towing units (tugboats and pushers) and 121 passenger vessels at the end of 2025. The number of towing units rose by two from 2024, and passenger vessels increased by 12, but the barge fleet’s composition shifted in a way that points to declining capacity rather than expansion: the number of self-propelled barges fell by seven, to 44, while non-self-propelled barges – those that must be pushed or towed – rose by six, to 186. Self-propelled barges also lost carrying capacity, falling to 36,192 tonnes from 40,681 tonnes, even as their installed power dropped to 18,864 kW from 20,725 kW.
Inland waterway fleet by vessel type, 2024 vs 2025 (units)
Source: Statistics Poland (GUS).
Non-self-propelled, pushed barges now account for 80.9% of the entire barge fleet and carried 857.3 thousand tonnes of cargo in 2025 – 51.3% of everything moved by inland waterway. Within the barge fleet, larger vessels dominate: 54.8% of self-propelled barges fall in the 1,000–1,649 tonne class, while non-self-propelled barges are spread more evenly, with the largest share (31.0%) in the 450–999 tonne bracket.
Barge fleet by carrying-capacity class, 2025 (% of each vessel type)
Source: Statistics Poland (GUS).
The fleet is also old. Every self-propelled barge in operation was built between 1949 and 1979, as was 69.8% of the pusher fleet and 54.8% of pushed barges. Only passenger vessels have been meaningfully renewed: 23.1% were built within the last 26 years, compared with a maximum of 10.0% for any other vessel category.
Age structure of the inland waterway fleet, 2025 (%)
Source: Statistics Poland (GUS).
Cargo volumes flat for the year, but swinging sharply by quarter
Total cargo carried by inland waterway barely moved in 2025, at 1,672.0 thousand tonnes versus 1,674.4 thousand tonnes in 2024 – a decline of just 0.1%. Transport work fell further, to 364.5 million tonne-kilometres from 384.8 million, down 5.3%. Behind these flat annual totals lies significant quarterly volatility: cargo volumes rose 27.9% year-on-year in the first quarter (with transport work up 3.6%), before cargo fell 15.7% in the second quarter and transport work dropped a further 12.1% in the fourth quarter.
Quarterly cargo volume and transport work, 2024 vs 2025
Source: Statistics Poland (GUS).
Trade with the rest of Europe still dominates, but the domestic market is growing fast
International transport – cargo moving to, from or between foreign ports – accounted for 64.2% of everything carried by Polish inland waterway operators in 2025, after the segment contracted 10.5% year-on-year, to 1,073.2 thousand tonnes from 1,199.3 thousand tonnes. Within international transport, movements between two foreign ports still dominate (85.7% of the international total, up 5.7 percentage points) even though their absolute volume fell 4.1%, to 919.5 thousand tonnes from 959.2 thousand tonnes. Exports fell more sharply, down 39.3% to 126.3 thousand tonnes from 208.1 thousand tonnes, and imports fell 10.3% to 26.9 thousand tonnes from 30.0 thousand tonnes. Germany was the only export destination reached by Polish inland waterway operators in 2025.
Cargo transport by direction, 2024 vs 2025 (% of total volume)
Source: Statistics Poland (GUS).
Domestic transport told the opposite story, growing 26.1% to 598.8 thousand tonnes and driving transport work up 52.5%, to 24.1 million tonne-kilometres from 15.8 million. The average haul length rose across the board: to 317.2 km for international transport (from 307.7 km in 2024) and to 40.2 km for domestic transport (from 33.2 km). Domestic cargo remains overwhelmingly short-haul: of the 598.8 thousand tonnes carried domestically in 2025, 274.4 thousand tonnes travelled 49 km or less and 319.9 thousand tonnes travelled between 50 and 149 km; only 4.4 thousand tonnes in total moved 150 km or further.
What’s actually being shipped
Metal ores and other mining and quarrying products, together with peat, uranium and thorium ore, remained the largest cargo category in 2025 at 41.7% of the total, up 1.4 percentage points from 2024. Agricultural, forestry and fishery products were the second-largest group at 21.5% (up 2.8 points), followed by an “other” category at 12.0% (down 0.6 points) and basic and fabricated metal products at 8.7% (down 0.7 points). The steepest decline came in secondary raw materials and waste, whose share nearly disappeared, falling to 0.4% from 5.0%, while coke and refined petroleum products grew faster than any other single category, to 7.3% from 4.8%.
Cargo carried by main commodity group, 2024 vs 2025 (% of total volume)
Source: Statistics Poland (GUS).
The Oder corridor: where most of the traffic runs
Statistics Poland separately tracks freight crossing key sections of the Oder waterway, Poland’s principal commercial river route linking Silesian industry with the Baltic ports of Szczecin and Świnoujście. Combined tonnage across all Oder sections rose 6.8% in 2025, to 483.6 thousand tonnes from 452.7 thousand tonnes, with transport work up to 27.2 million tonne-kilometres from 22.4 million. The Lower Oder section alone carried 350,345 tonnes in 2025 – by far the largest single segment, even though it fell 6.5% from 374,641 tonnes the year before. The Szczecin sea-lagoon section more than doubled, to 108,919 tonnes from 47,489 tonnes, and the canalized Upper Oder nearly doubled, to 8,656 tonnes from 4,935 tonnes. The short connecting sections that link these stretches together still carry only a few thousand tonnes a year each.
| Oder waterway section | 2024 (tonnes) | 2025 (tonnes) |
|---|---|---|
| Total, all sections | 452,748 | 483,617 |
| Upper Oder, canalized | 4,935 | 8,656 |
| Middle Oder (free-flowing) – Upper Oder (canalized) | 2,228 | 761 |
| Upper Oder (canalized) – Lower Oder | 515 | 2,301 |
| Lower Oder | 374,641 | 350,345 |
| Szczecin Lagoon – Lower Oder | 22,940 | 12,635 |
| Szczecin Lagoon (sea section) | 47,489 | 108,919 |
Source: Statistics Poland (GUS).
Fewer passengers, but longer trips
River tourism moved in the opposite direction to freight. Poland’s 121 passenger vessels – 12 more than in 2024 – carried 1,007,575 passengers in 2025, down 8.1% from 1,096,890. Even so, total passenger-kilometres rose 6.2%, to 12,558,439 from 11,830,725, as the average trip length increased to 12 km from 11 km, and passenger seating capacity expanded to 11,501 from 9,871.
| Passenger transport by inland waterway | 2024 | 2025 |
|---|---|---|
| Passenger seats | 9,871 | 11,501 |
| Passengers carried | 1,096,890 | 1,007,575 |
| Passenger-kilometres | 11,830,725 | 12,558,439 |
| Average trip length (km) | 11 | 12 |
Source: Statistics Poland (GUS).
Inland waterway transport remains one of the safest modes available. Authorities responsible for inland shipping recorded just three accidents in 2025, none of which involved the transport of dangerous cargo.
What it means
Taken together, the 2025 data describe a mode of transport that is structurally marginal – 0.07% of Poland’s total freight task – but not necessarily in decline. Domestic cargo grew by more than a quarter, and tonnage on the Oder corridor rose alongside it, suggesting genuine underlying demand for river transport close to the Baltic ports. What is missing is the capacity to carry it further: only 5.5% of the network meets international navigability standards, the barge fleet’s most capable segment is contracting rather than growing, and most vessels still in service were built before 1980. Without renewed investment in both the waterways and the fleet, Poland’s rivers look set to remain a marginal, largely local complement to road and rail, rather than the international-standard corridor that EU transport policy has long envisioned.
Data are drawn from Statistics Poland’s (GUS) statistical brief “Inland Waterway Transport in Poland in 2025” (Informacje sygnalne), released on 29 July 2026 and prepared by the Statistical Office in Szczecin. Figures cover Polish-flagged inland waterway operators and the domestic waterway network; percentage changes are year-on-year unless stated otherwise.