
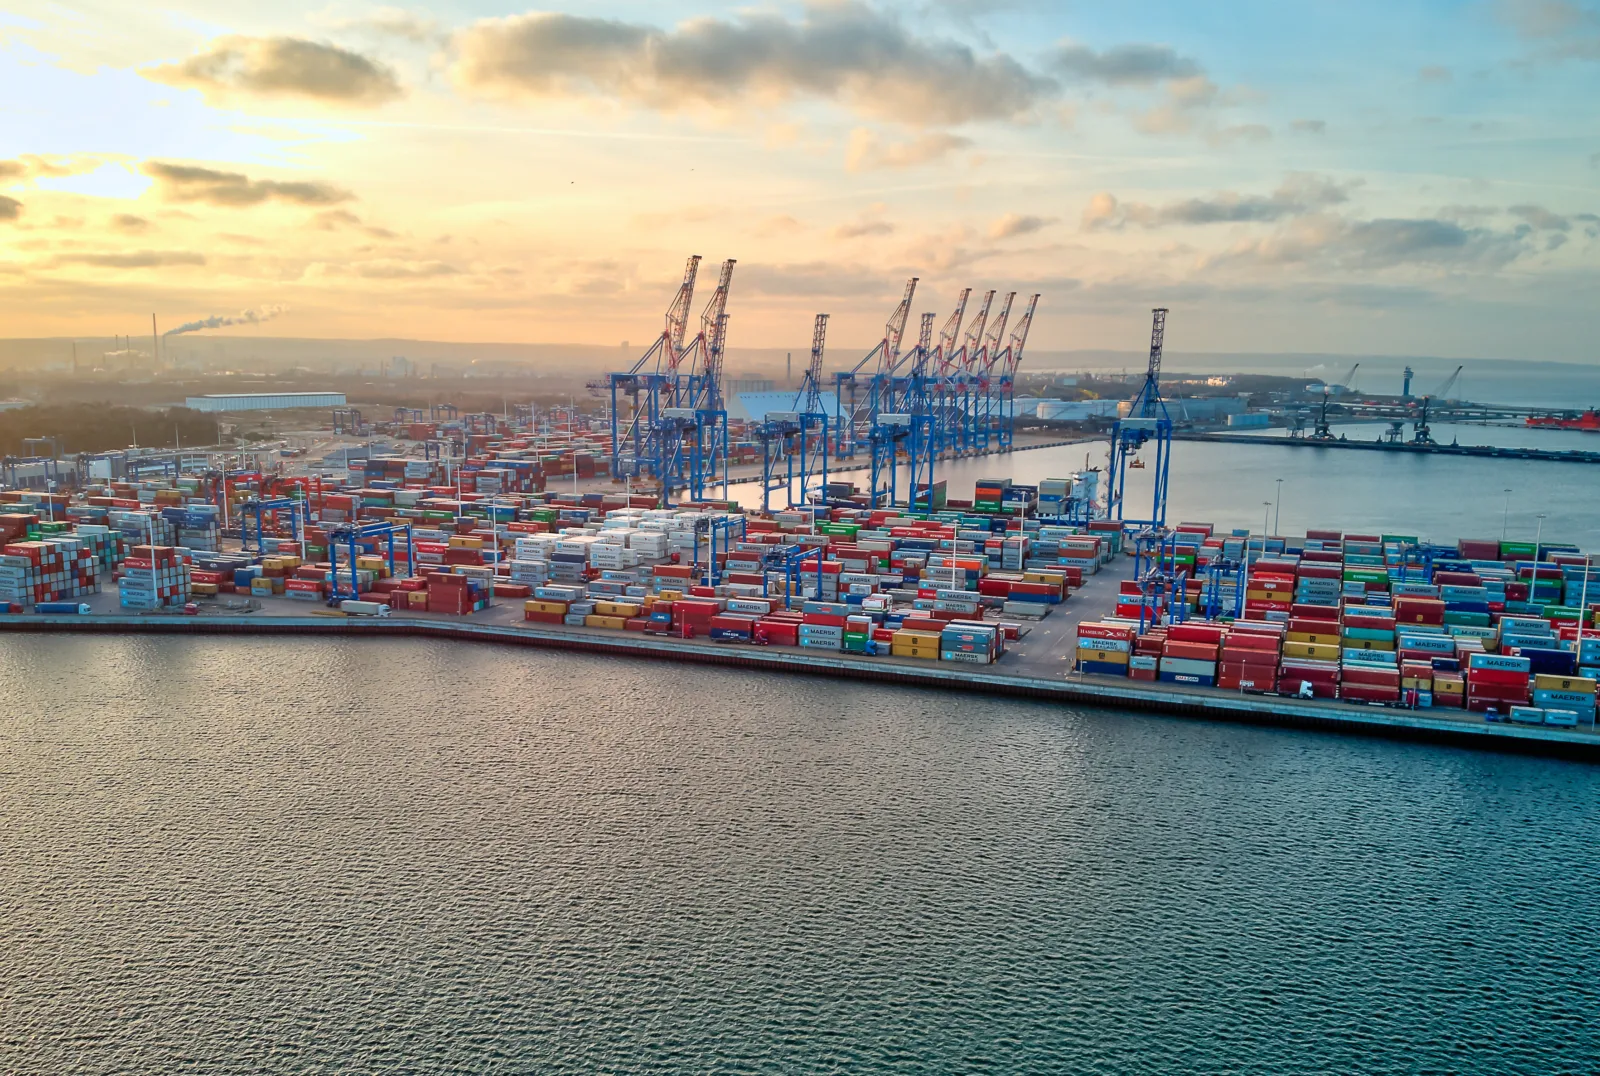
The global ocean economy generated an estimated $3.5 trillion in real value added in 2025, according to OECD projections. It expanded by 132% over three decades as non-OECD Asian economies increased their share from 16% to 36%, with shipping, ports, shipbuilding and equipment manufacturing recording the fastest growth.
By Adam Ujazdowski. Adapted from the Polish original, published on 7 November 2026. Photo: Jurand – stock.adobe.com.
In The Ocean Economy at a Glance, the Organisation for Economic Co-operation and Development (OECD) examines 49 ocean-related activities. These include shipping, ports, coastal tourism, fishing, offshore oil and gas extraction, and marine renewable energy. Together, they accounted for about 3% of global value added and employment equivalent to 103 million full-time jobs in its 2025 projections.
Value added measures these industries’ contribution to the economy after deducting the goods and services used in production. The $3.5 trillion figure is expressed in real terms with 2022 as the reference year. Country and industry shares are calculated at current prices, so the two measures cannot be directly converted into one another.
Non-OECD Asia overtakes Europe
OECD members generated 73.2% of global ocean-economy value added in 1995, compared with a projected 50.5% in 2025. Over the same period, non-OECD Asian economies increased their share from 16% to 36%. They have been the largest regional group in the ocean economy since 2010.
The shift was particularly pronounced among Asian OECD members, whose share fell from 27.3% to 8.6%. European members’ share declined from 27.4% to 21.4%. The OECD’s share fell across all five main ocean-economy sectors, most sharply in fishing, aquaculture and processing.
Non-OECD Asia more than doubles its share
Share of global ocean-economy value added, current prices
■ 1995 ■ 2025
China and the United States were the largest individual ocean economies in the 2025 projections, with value added of $500 billion and $443 billion respectively at current prices. Together, they accounted for 28.4% of the global total.
Ports and shipping lead growth
Real value added in the ocean economy increased by 132% between 1995 and 2025, compared with 125% for the world economy overall. The fastest-growing group comprised maritime transport, ports, shipbuilding and equipment manufacturing. Its value added reached 3.4 times the 1995 level, with average annual growth of 4.2%.
Within that group, sea and coastal transport and ports grew fastest, at annual rates of 4.8% and 4.4% respectively. Shipbuilding value added grew by an average of 2.9% a year. Transport’s share of the group’s value added rose from 31% to 41.4%, while shipbuilding’s share fell from 15.6% to 10.5%.
Transport, ports and maritime manufacturing grow fastest
Average annual real growth in value added, 1995–2025
China has generated the largest amount of value added in this group of industries since 2012. Its share rose from 2.7% in 1995 to a projected 21.5% in 2025, followed by the United States at 15.8% and Singapore at 7.1%.
Tourism remains the largest sector
Marine and coastal tourism remained the largest part of the ocean economy, accounting for a projected 28.6% of value added in 2025. Transport, ports, shipbuilding and equipment followed with 25.6%. Offshore energy and the extraction of non-living marine resources, including oil, gas and minerals, accounted for 23.7%.
Tourism remains the largest ocean-economy sector
Share of ocean-economy value added in 2025, current prices
Tourism was still recovering from the pandemic’s effects. Its real value added fell by 32.5% in 2020 and did not regain its 2019 level until 2023. Employment recovered later, reaching its pre-pandemic level in 2025 according to the OECD projections.
Offshore energy and non-living marine resources recorded the slowest growth of the five main groups over the full period, averaging 1.8% a year. Offshore wind and other marine renewables grew by an average of 16.9% annually, albeit from a very low base. Oil and gas extraction still generated the overwhelming majority of the group’s value added.
Employment shifts from fishing towards services
Ocean-economy employment rose by 33% between 1995 and 2025 to around 103 million full-time equivalents (FTEs). Marine and coastal tourism became the largest employer, expanding from 22.8 million to a projected 43.4 million FTEs. Employment in fishing, aquaculture and processing fell from 31.5 million to 20.5 million.
Employment shifts from fishing to services
Employment, million full-time equivalents (FTEs)
■ 1995 ■ 2025
Employment in transport, ports, shipbuilding and equipment manufacturing increased from 11.3 million to 16.6 million FTEs. Ports accounted for 88% of that increase, expanding their workforce from 2.5 million to 7.2 million FTEs. Across the ocean economy, real value added per FTE rose by 75%, compared with 58% in the world economy.
China also increases its share of ocean research
The shift extends to scientific research. China’s share of global ocean-related publications rose from 1.7% in 1996 to 30.9% in 2024. It has ranked first by publication volume since 2018, while non-OECD economies collectively have published more than OECD members since 2021.
Research on offshore wind, wave and tidal energy, and desalination and water-treatment technologies expanded fastest. Underwater acoustics, sensors, communications and robotics became the largest of the 24 research fields identified in 2024, accounting for 6.7% of ocean-related publications.
The OECD’s statistics are experimental and cover 1995–2025. All figures for the final year are projections based on earlier trends. The organisation expanded its coverage from 33 to 49 activities compared with the previous edition, so figures from different editions should not be treated as a single consistent series.
Source: OECD (2026), The Ocean Economy at a Glance; OCEANSTAT database; and analysis of scientific publications using Scopus. Charts prepared from the report’s data.